How video analytics can improve your business operations
Video analytics isn’t just for security anymore. See how organizations across different industries use analytics to streamline their operations.

Video analytics have come a long way in the physical security industry. Recent AI advances such as machine learning and deep learning have enhanced the accuracy and power of analytics. And over time, analytics have also become less costly making these tools even more interesting and accessible to organizations in various industries.
While the demand for video analytics continues to surge, organizations aren’t only considering security applications anymore—many are looking at how to use video analytics to improve business operations too.
Keep reading to find out how automatic license plate recognition (ALPR), people counting, and crowd estimation can be used to streamline processes, enrich the guest experience, and gain deeper insights into your businesses.
Keep city transit and road traffic moving with video analytics
If you’re in the mass transit industry, you know a crowded transit platform is a sign that demand is high. While that’s a good thing for your business, your customers might think otherwise. After all, there’s no fun in waiting around when you have places to go to.
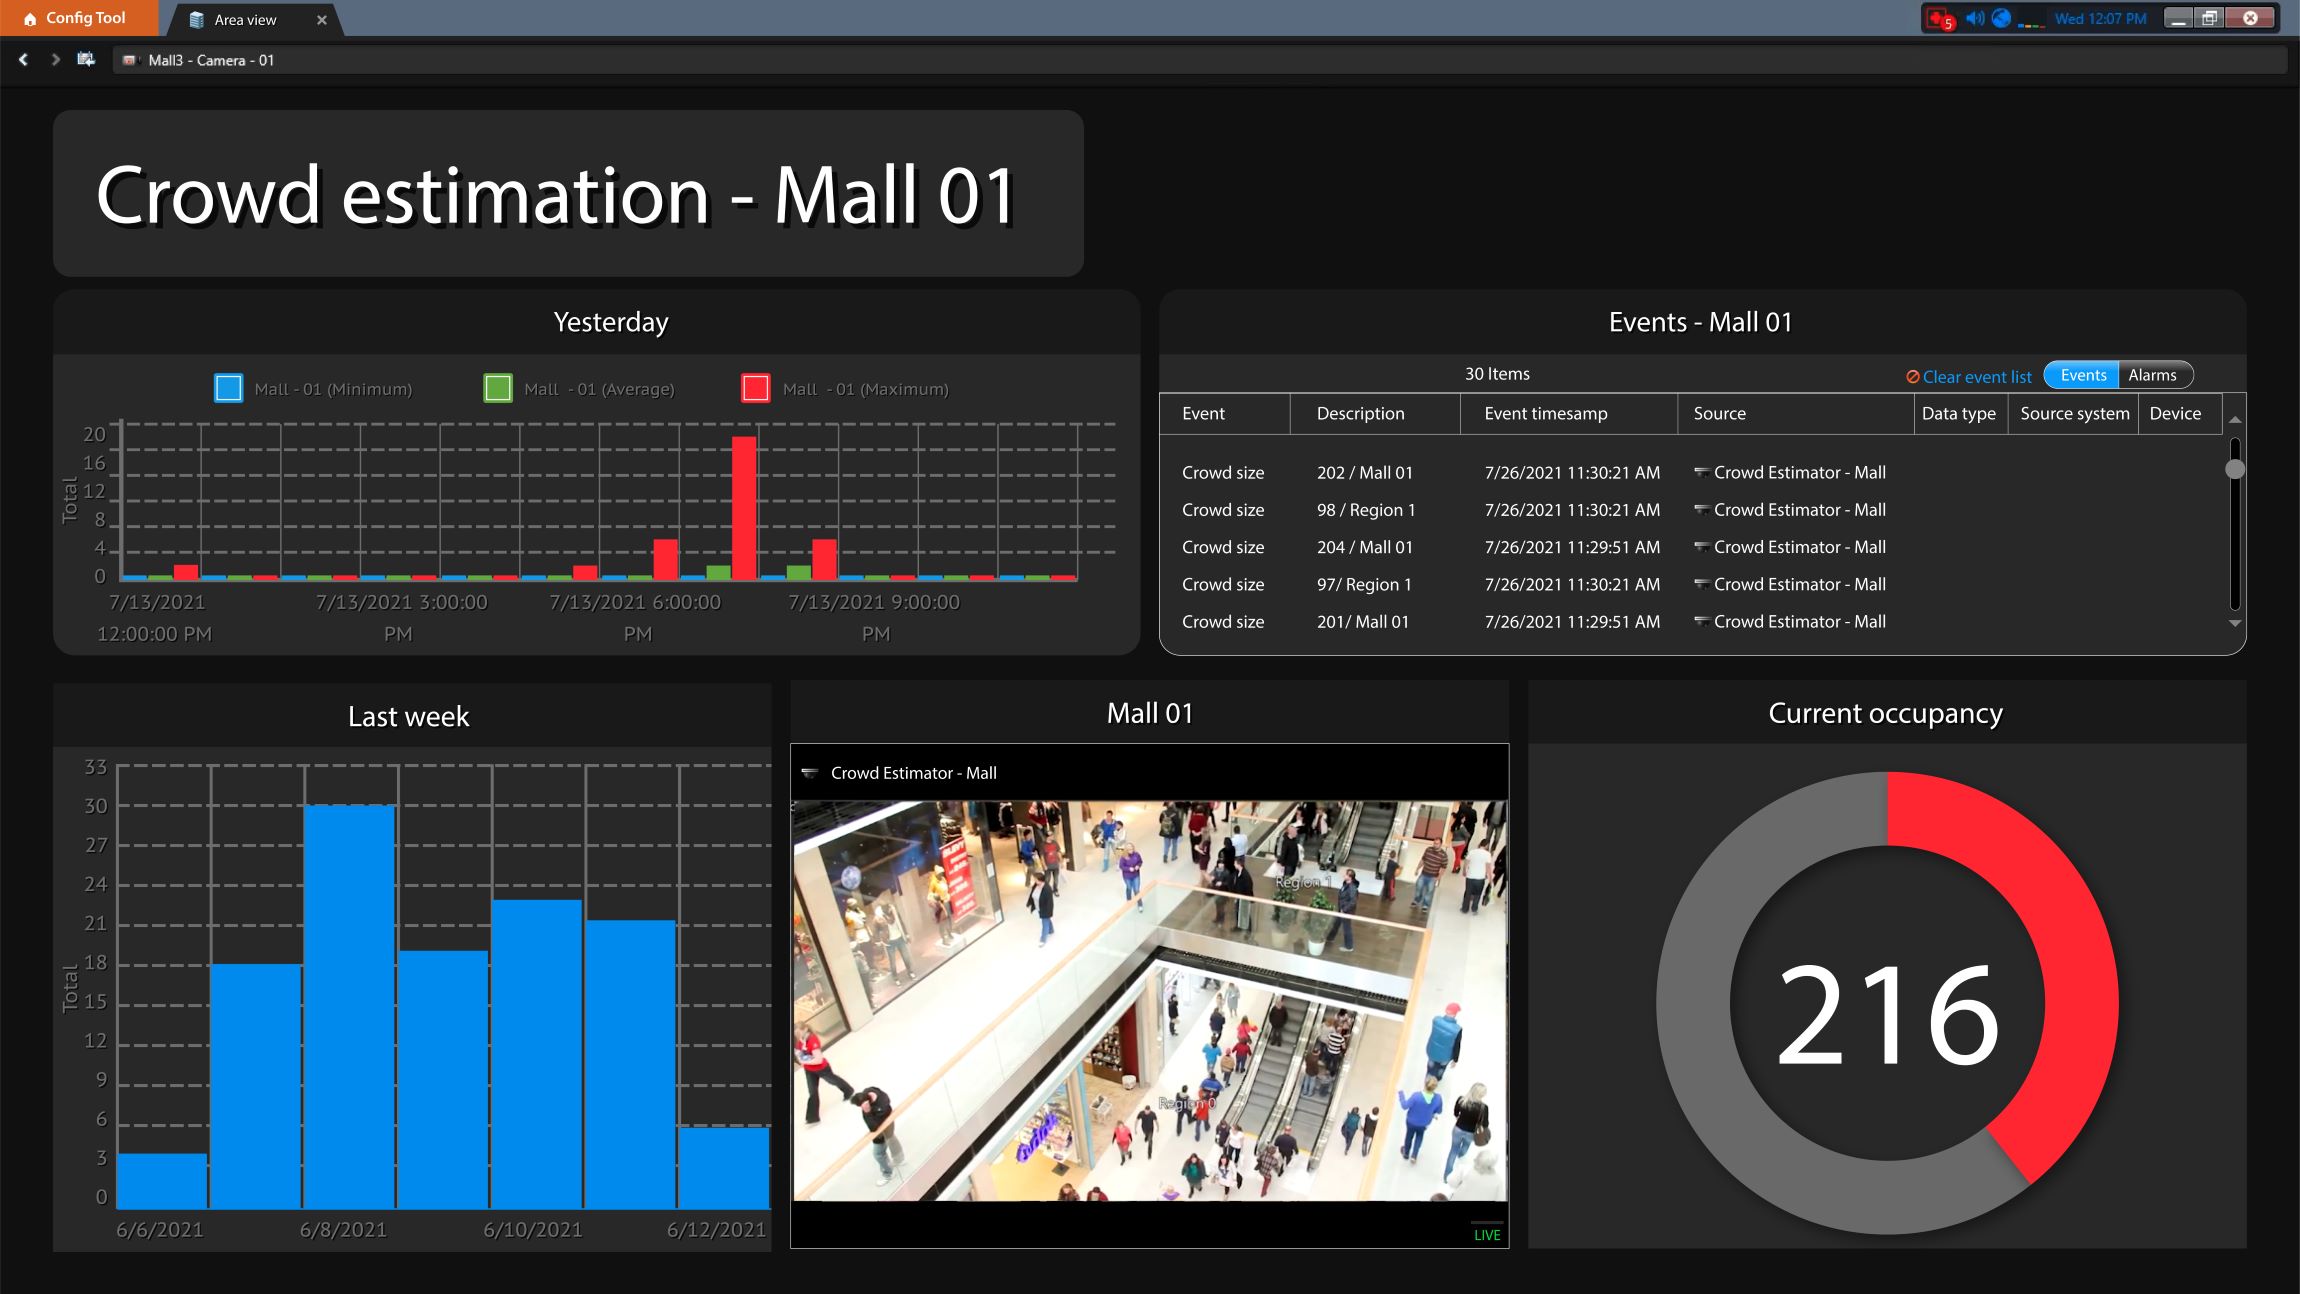
Using people counting and crowd estimation analytics, you can keep track of how many people are waiting for trains or buses at different times and adjust service frequency to align with actual demand. You can also identify times and locations with peak foot traffic to better allocate resources and alleviate congestion, potentially boosting customer morale.
When you combine intercom and video analytics in one security platform, there’s also an opportunity to pre-program passenger announcements. For instance, you can automatically trigger an announcement that directs passengers to other areas of the platform if too many people are clustered together in one location. If you have people counting video analytics onboard trains, the security platform could also alert passengers on the platform which sections of the approaching vehicle have the most room.
On city roadways, video and ALPR analytics can help city planners and traffic engineers collect valuable information about what’s happening. They can review vehicle traffic data such as how many cars are on a given road or going through a specific intersection.
Some cities even use this information to re-route traffic through alternative routes during rush hour to avoid congestion and optimize vehicle flow through streets. This not only makes commuters happy but also reduces car emissions because vehicles are moving at a more consistent speed.
Improve the shopping experience with people counting and ALPR
In the retail industry, knowing your customer is vital. It helps you tailor every aspect of the shopping experience to their needs and preferences to increase your bottom line. It’s this very reason why online retailers have seen such huge success. And while brick-and-mortar stores haven’t had the same level of data at their fingertips, video analytics solutions are helping them compete.
Using video surveillance analytics such as people counting, you can find out how many people come into your stores at any given time. Besides understanding your busiest times and days, this can help you measure the success of marketing initiatives by tracking people’s influx into the store before, during, and after your promotional campaigns.

You can also analyze merchandising browsing behaviors by looking at heat maps. Or calculate conversion rates by seeing how many people simply visit your stores versus those who buy your products.
All this information can help your team make informed decisions. That might include moving popular products closer to the front of the store or adding more staff on certain days.
For larger retail establishments like shopping malls, video analytics, and ALPR technology can help you track vehicle flow at entry and exit points. If there’s a slowdown or build-up of traffic, the system can alert your team to dispatch personnel to better direct customers through your lots.
You can also collect vehicle traffic data over time. This helps you spot important trends which can then inform for improvements to your facilities and the customer experience.

Understand how people use your office space with occupancy data
Following the pandemic, many corporate offices have adopted a hybrid work environment. This split between working at home and in the office has led organizations to rethink how they use their office space. That said, even those with employees back in the office full-time are interested in finding the best ways to optimize their workspace.
The use of video analytics gives you the information you need to track occupancy patterns and get a better sense of how and when your office resources are being used. As part of that process, you might ask: ‘Do people use all the meeting rooms? How often do people use our large meeting rooms?’
If you discover that most meetings include four or fewer people, you may decide to split up one large room to create smaller spaces. While reviewing data, if you see that in-office employee attendance spikes on Wednesdays, you might decide to add more desk-sharing options.
Some offices also have warehouses and factories on-site where enhancing workplace safety could be your goal. Using video analytics helps you determine if staff are consistently wearing full protective gear when on the job. Video analytics can be used to establish a benchmark for how often correct procedures are followed or not. This can offer clues that may help you define new routines or protocols to keep employees safe.
Enhancing the passenger journey through airports
Airports aren’t just committed to making sure you travel safely. While moving through an airport, various operational teams are working hard to make sure you have a smooth and pleasant experience.
To make this happen, many airports now rely on information collected from video analytics tools. From people counting and crowd estimation, these data points give them new insights into the passenger journey from the curbside to the gate. With that, they can better understand how long people stand in security lines, where roadblocks occur, and where people gather. They can then either open up new queues to ease bottlenecks or make changes that optimize the flow of people through their spaces.
Airports can also optimize their staffing and inform passengers where they should go and how long they can expect to wait in security lines. And when they move through those lines and checkpoints quickly, they can spend more time eating in restaurants, shopping at duty-free, or enjoying other amenities in the terminal lounge. All of this helps to maximize revenues and ensure every traveler has great things to say about their airport journey.
Speeding up security maintenance with system health tools
No matter what industry you work in, handling maintenance on your security systems and infrastructure takes time. If you’re overseeing a large and distributed environment, you’ll likely need full-time staff to ensure all your cameras, door readers, and other IoT sensors are optimized and working well. When you have multiple locations, sometimes those team members will need to travel to various sites and physically check on issues that come up.
These types of tasks can potentially drain time and resources.
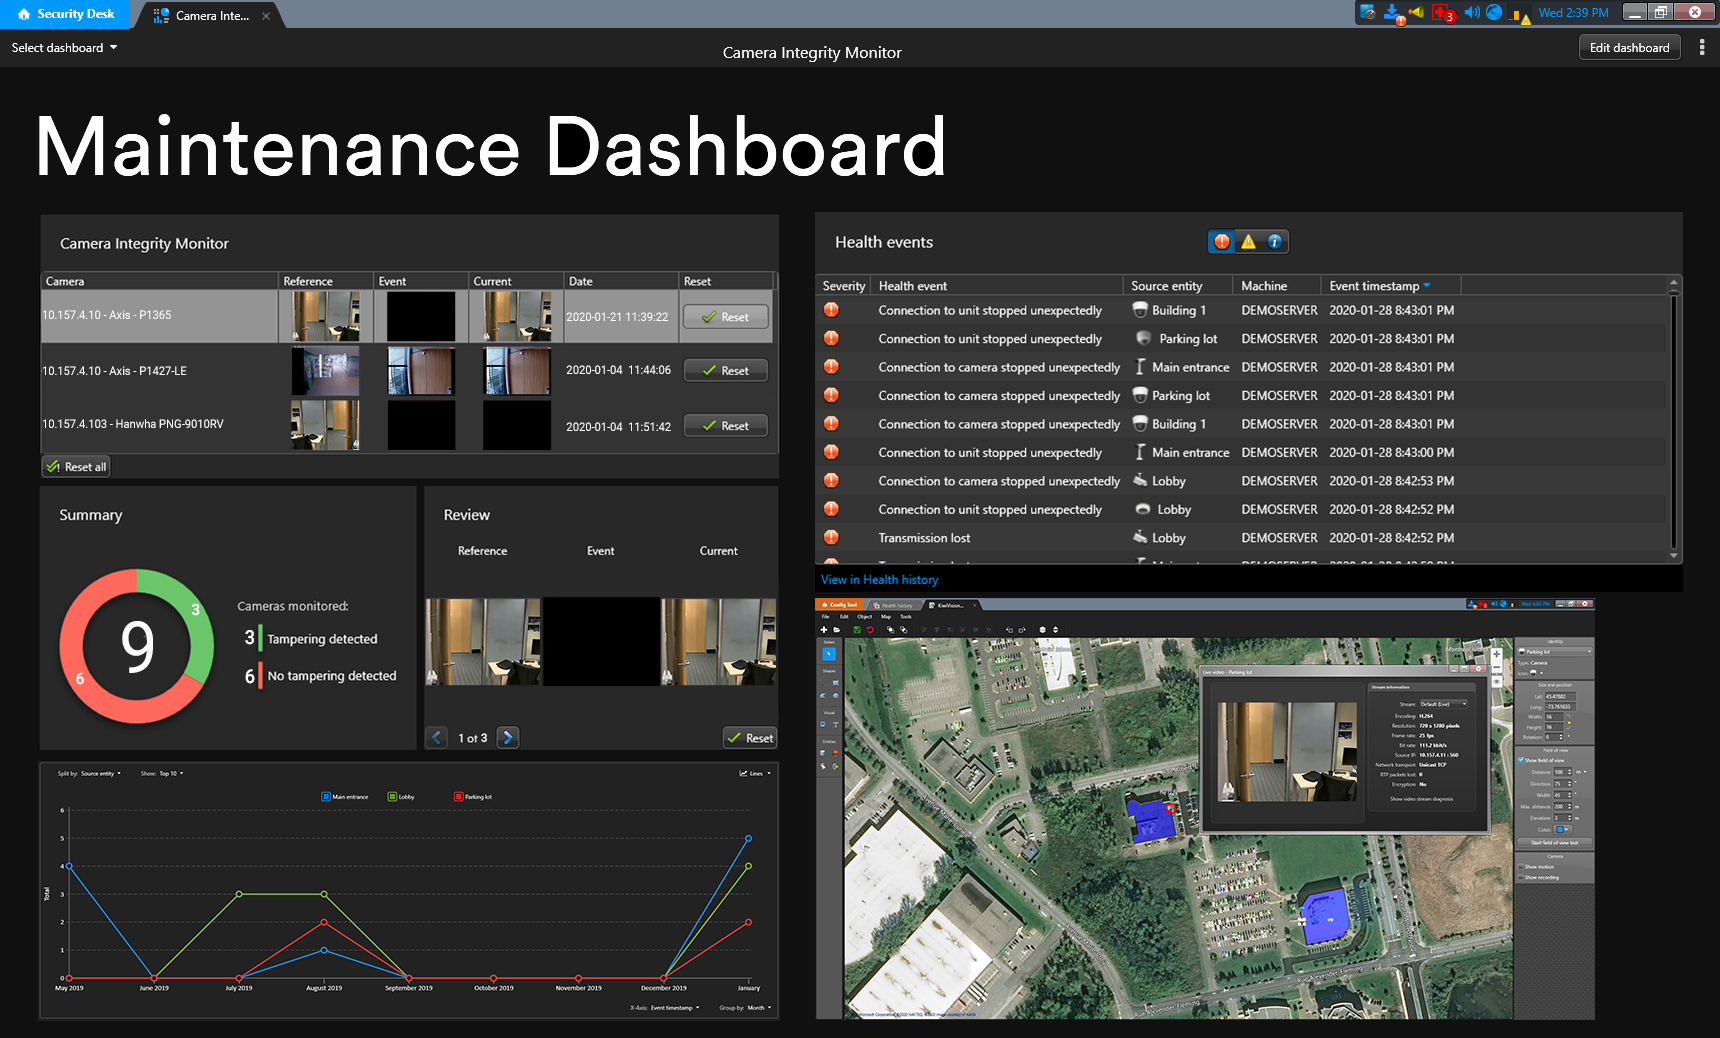
Using video analytics such as camera integrity monitor or system health monitoring tools, reduce the time needed to handle those maintenance tasks. The system will alert you as soon as it detects camera events such as tampering, decreased video quality, or abrupt directional change.

In Security Center 5.10, you can easily view camera integrity monitor events from an intuitive dashboard. At a glance, this shows you which camera is causing issues as soon as an event is detected. You’ll also see a thumbnail of current footage to assess whether you need to send someone out to physically check on things or not.
Using dynamic health dashboards and widgets, you can also track things like doors being forced open or readers falling offline. All incoming events are displayed in visual graphs. Depending on your preference, you’ll see easy-to-understand pie charts or bar graphs showing the number and frequency of different events.
This helps you quickly spot recurring issues or anomalies that need addressing. You can then investigate alarms or retrieve event reports to know when there are bigger issues at play, or if devices need replacing.
Staying open to video analytics opportunities
As artificial intelligence and machine learning continue to advance, video analytics will become even more powerful than they are now. This presents a significant opportunity for businesses to use their security systems in new ways and enhance their operations.
And while professionals in certain industries might be more familiar with or interested in specific video analytics applications, learning about how others are using office space, foot traffic, or vehicle traffic data can inspire new ways of thinking and working.
Trying out video analytics in your own environment is the best way to choose which applications are best suited for your organization's needs, and to understand how they'll benefit your day to day operations for the better.
